Dashboard
A web UI for jobs, queues, workers and schedules, served from inside your ASP.NET Core app.
On this page
Runwick.Dashboard is a web UI that runs inside your own ASP.NET Core app. It reads and acts through the same layer as the management API, so it has the same permissions, limits and audit trail. Its web files are embedded in the package; you do not need Node or npm.
Setting it up
The dashboard needs AddRunwickManagement, because it uses its sign-in schemes and grant mapping by default.
AddRunwickDashboard takes a mount ID (1 to 32 characters of a-z, 0-9 and -). You can register several mounts with different IDs and map each at its own path. MapRunwickDashboard(path, mountId) uses "default" when you leave out the ID.
You do not have to call MapRunwickManagement for the dashboard to work. Map it only if you also want the JSON API or the CLI.
Options
Per-mount schemes are useful when the JSON API uses bearer tokens for machine clients and the dashboard uses cookies for people.
Order with your own Inertia app
The dashboard is built on Inertia.Net. If your app also uses Inertia, map the dashboard before your own UseInertia():
Otherwise your app's Inertia middleware version-checks the dashboard's requests and sends its pages into a reload loop. Runwick cannot detect the wrong order, so this is on you.
Do not put your own routes under the dashboard path
The dashboard owns everything under its path. If one of your endpoints has a route under it, Runwick logs a critical error and stops the application once it has started. Until that check has run, the dashboard answers 503.
Permissions
Each page needs the permission behind the data it shows, and each button needs the permission for its action. The navigation lists only the pages the caller may open; other pages answer 403.
A payload or an error detail is hidden until someone with Jobs.ReadPayload or Jobs.ReadError clicks reveal, and every reveal writes an audit row. Errors show only their code until revealed.
Hiding a button is a convenience, not security: the server checks every request again.
What you see
- Overview: key figures with small trend lines, recent failures, queues and recent scaling events.
- Jobs and Runs: each job type with its numbers, then the individual runs with filters by queue, state, name and time range. Cancel, retry and rerun from the list or the run page.
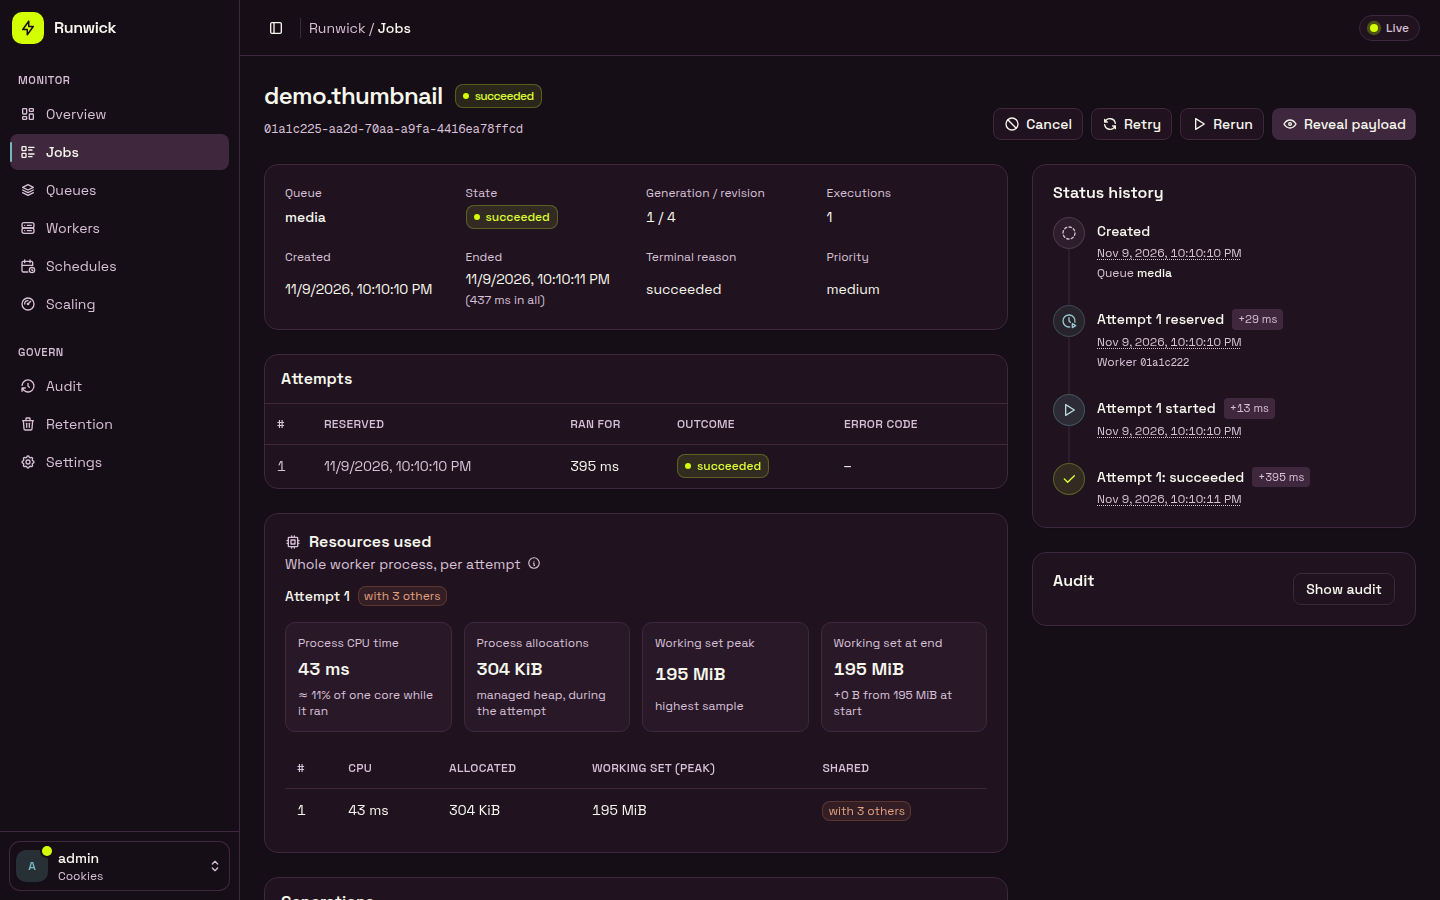
- Run: a job's status history, its attempts and the resources each attempt used.
- Queues, Workers, Pools, Schedules: each with a detail page. Pause and resume queues and schedules, trigger a schedule, set a concurrency limit.
- Retention and Audit: the cleanup policy with its progress, and the trail of who did what.
Lists show 50 rows a page with a "Next" link. There are no page counts or grand totals. Each list says when it was read ("as of 12:04:31").
What it is not
Know these limits
- Not live. Pages poll every few seconds while the tab is visible (5 s at the fastest, and you can pick a slower interval or turn it off). There is no push channel.
- No queue-depth totals of its own. Figures on the Overview are tallies of what one read returned, shown as "50+" when there is more.
- "Cancel requested" is not "stopped". Cancellation is cooperative; a running handler stops only when it honours its token. See Cancellation.
- A revealed payload cannot be taken back from a browser that has seen it.
- Permissions are per application and queue, not per tenant.
- Rate limits are per process. Several replicas each allow the full rate.
Running it on its own
The dashboard does not need a worker in the same process. A small internal app with only AddRunwick, AddRunwickManagement and AddRunwickDashboard is a common shape. See A standalone management host.
The repository's samples/Runwick.Dashboard.Host shows a complete host: cookie sign-in, three users with different grants, a path base, and the dashboard mounted before the host's own Inertia pages.